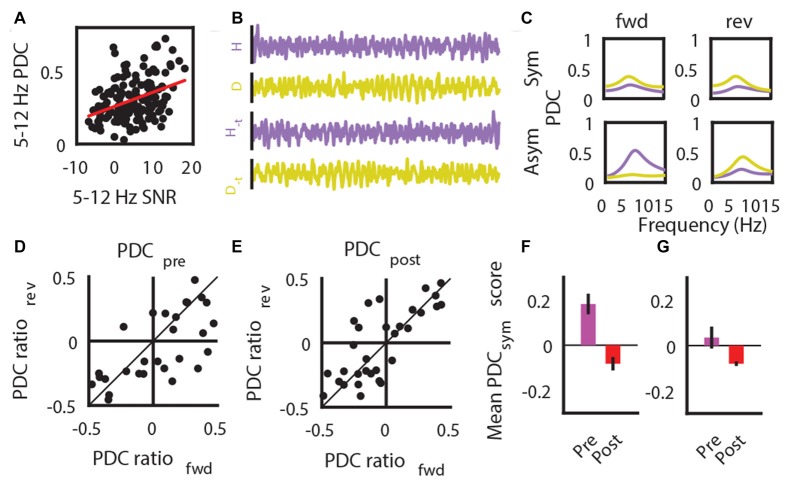
Figure 8.
Low SNR impacts on PDC estimates. (A) SNR correlation with the magnitude of PDC estimates. (B) Example LFP traces that are in its original form and time-reversed form (−t). (C) Example data showing results comparing the magnitude of forward (fwd) and reversed (rev) time PDC measures results in symmetric estimates (top row) indicative of erroneous estimates of causal influence due to low SNR, and asymmetric (bottom row) estimates that is consistent with expected outcome of time-reversal. (D) PDC symmetry between forward (fwd)- and reversed (rev)- time estimates, as assessed by a difference ratio between HPC to SuM/MM PDC and SuM/MM to HPC PDC estimates prior to MS-inactivation. (E) PDC symmetry between forward (fwd)- and reversed (rev)- time estimates, as assessed by a difference ratio between HPC to SuM/MM PDC and SuM/MM to HPC PDC estimates after MS-inactivation. (F) Mean magnitude of overall HPC-SuM/MM PDC differences pre- and post-MS-inactivation, based on data points that have significantly asymmetric PDC for fwd- or rev time estimates. (G) Mean magnitude of overall HPC-SuM/MM PDC differences pre- and post-MS-inactivation, based on data points that have significantly asymmetric PDC for fwd- and rev- time estimates. PDC, partial directed coherence; SNR, signal-to-noise ratio; H, hippocampal LFP; M, mammillary area LFP; −t, time-reversed LFPs; Sym, symmetrical PDC spectra; Asym, asymmetrical PDC spectra; PDCsym, PDC symmetry score.

