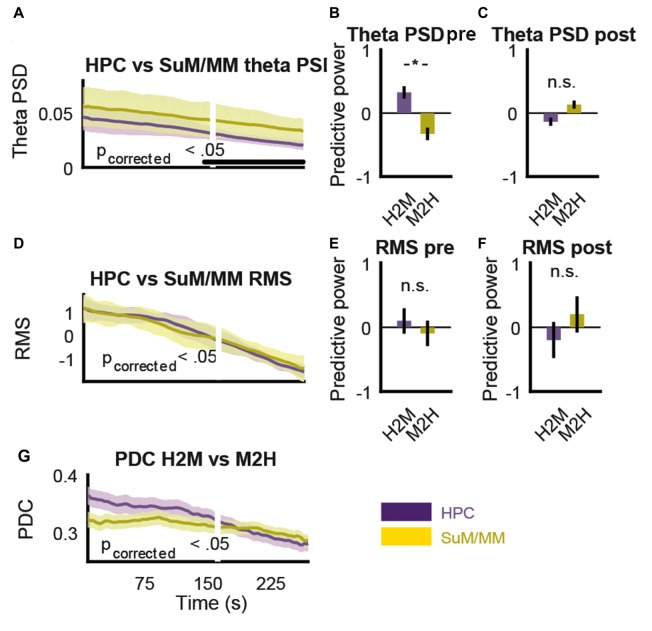
Figure 9.
MS-inactivation leads to dissociable changes in non-theta and theta inputs to the SuM/MM. (A) Change in HPC and SuM/MM theta PSD across time. The white line denotes the time point where RMS decrease reached 50%. Statistical significance is denoted by the black bar. (B) Averaged significant F-ratios from theta PSD regression model (predictive power) before the point of significant theta PSD divergence. (C) Averaged significant F-ratios from theta PSD regression model (predictive power) after the point of significant theta PSD divergence. (D) Change in HPC and SuM/MM RMS values across time. There is no detected causal influence in either direction. (E) Averaged significant F-ratios from RMS regression model (predictive power) before the point of significant theta PSD divergence. (F) Averaged significant F-ratios from RMS regression model (predictive power) after the point of significant theta PSD divergence. (G) Changes in PDC measures for both directions in the same time period as (A,D). PSD, power spectral density, RMS, root mean squared power; PDC, partial directed coherence; H2M, HPC->SuM/MM PDC score; M2H, SuM/MM->HPC PDC score; HPC, hippocampus; SuM, supramammillary nucleus; MM, mammillary nucleus. *p < 0.05; n.s. not significant.

