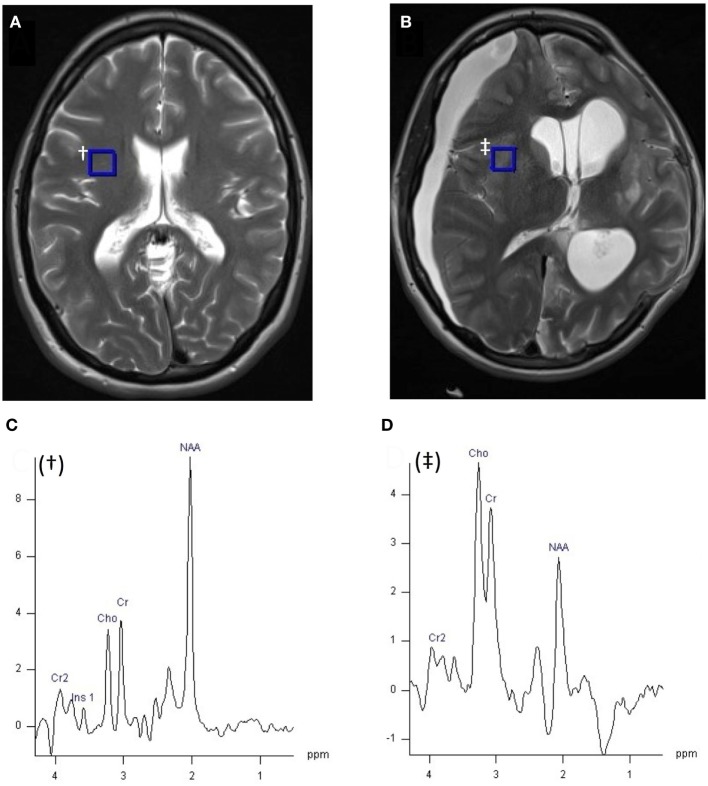
Figure 2.
1H MRI (T2W axial slice) and 1H magnetic resonance spectroscopy chemical shift imaging (CSI) (echo time 135 ms, TR 2,200 ms, 3 averages, 4:41 min acquisition time, 200 ms Hanning filter) of healthy control (A), and patient with acute severe traumatic brain injury after craniectomy (B) acquired with a 12 channel 1H volume coil on a Siemens 3 T scanner, data analysis performed with Siemens Syngo software. Panel (A) demonstrates the position of the selected voxel (blue square, †), represented in panel (C), within the CSI grid (hidden). (C) 1H spectrum of 10 mm × 10 mm × 15 mm voxel † from healthy volunteer (A). (D) 1H spectrum of 8 mm × 8 mm × 15 mm blue square voxel ‡ of patient (B), within the CSI grid (hidden). Metabolite peaks are annotated in panels (C,D): Cr, creatine; Cho, choline; NAA, N-acetylaspartate, chemical shift on the x-axis in parts per million, signal intensity on y-axis using arbitrary units. Unpublished images by Tonny V. Veenith, courtesy of the Wolfson Brain Imaging Centre, Cambridge, UK.

