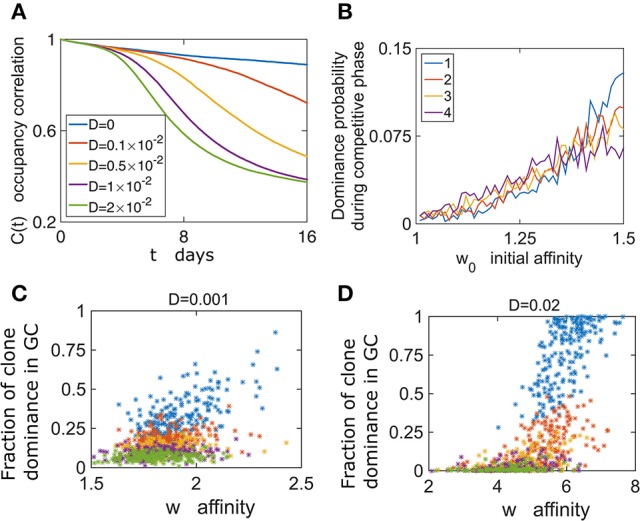
Figure 4.

GC content depends on the initial conditions. (A) Following growth phase of 6 days, we estimate the occupancy correlation C(t) Equation (10) during the competitive phase. (B) The dominance probability depending on the initial affinity w0. In the growth phase all cells proliferate with the same rate λ0. w0 determines the birth rate in the competitive phase according to Equation (6) (D = 0.02). (C,D) The dominance probability is shown for the most dominant clone (blue), second dominance (red), third (yellow) fourth dominance (purple), and fifth (green).
