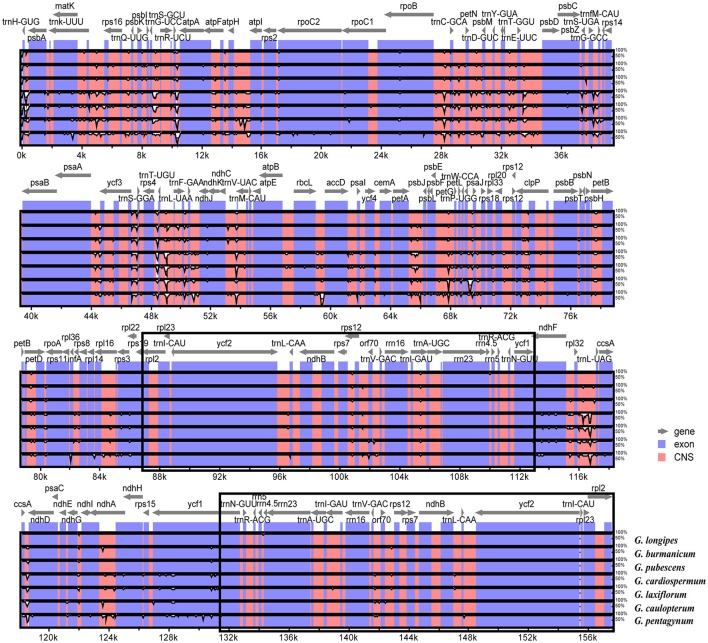
Figure 6.
Sequence identity plots among eight sequenced chloroplast genomes, with G. pentaphyllum as a reference by using mVISTA. The vertical scale indicates the identity percentage ranging from 50 to 100%. The horizontal axis corresponds to the coordinates within the chloroplast genome. Coding and non-coding regions are marked in blue and pink, respectively. Annotated genes are displayed along the top. The black boxes show the two IR regions.

