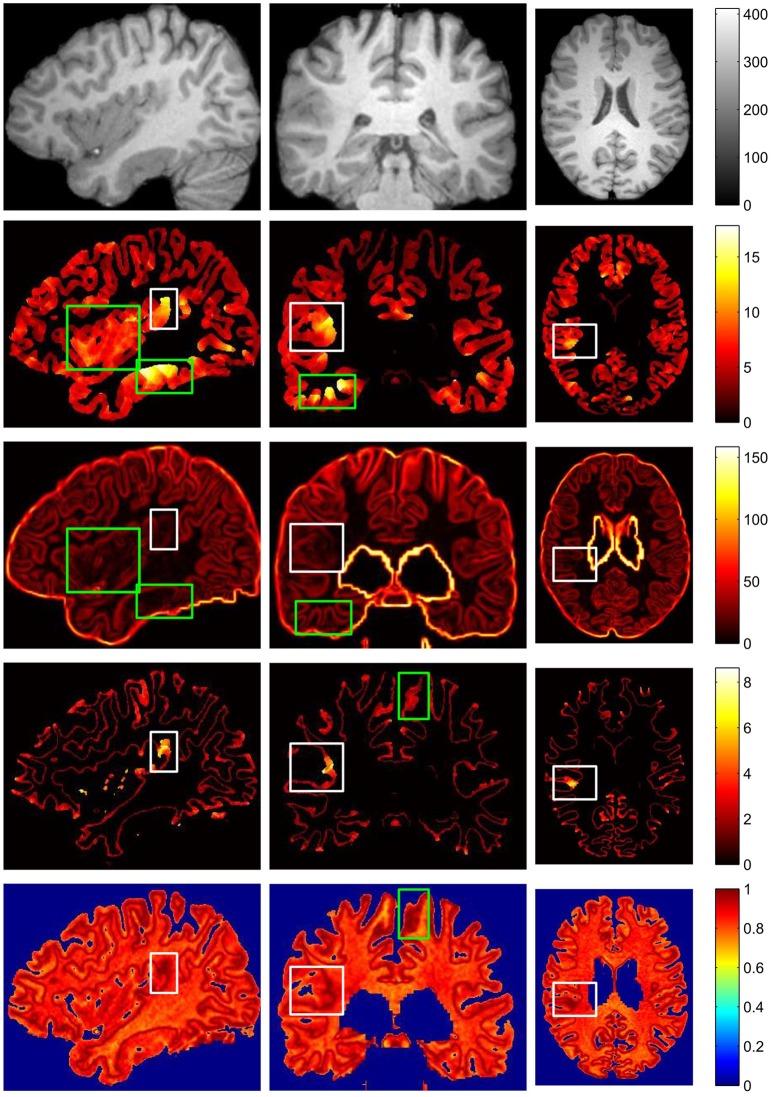
Figure 10.
The comparison of different FCD feature maps in three views. From up to down, images on each row are preprocessed MR image, gray matter or cortical thickness map, gradient map, GWB width map, and relative intensity map. From left to right, columns are sagittal view, coronal view and axial view. The images are randomly extracted from three dimensional image from one patient. The true FCD lesional regions are surrounded by white rectangles, while the false positive regions are indicated by green rectangles.

