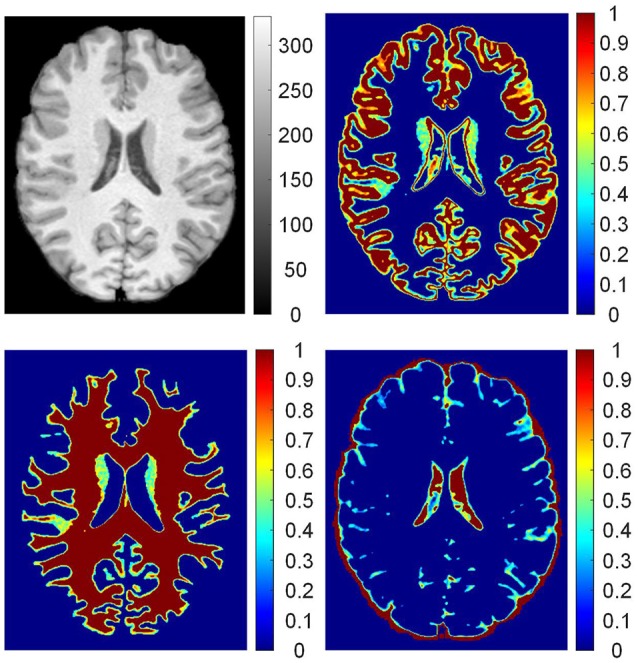
Figure 3.

The probability images of brain tissues. From up to down, clockwise, images are: preprocessed T1 weighted magnetic resonance (MR) image; probability images of gray matter (GM), cerebrospinal fluid (CSF), and white matter (WM). On the T1 weighted MR image, values are intensities of the gray image. In the probability images, the values are proportions of brain tissue in the voxels.
