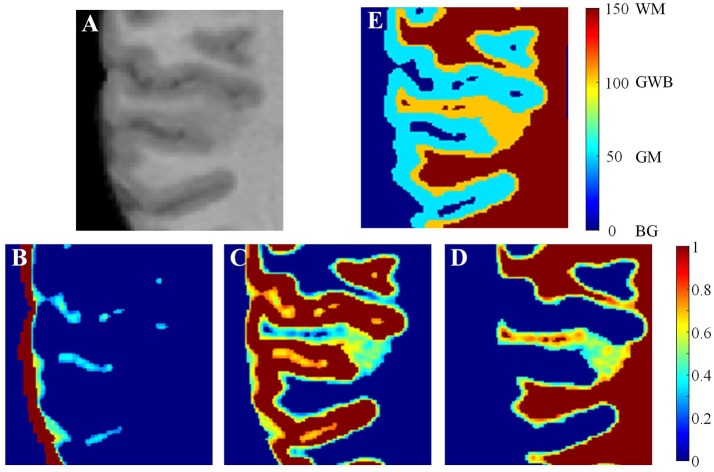
Figure 4.
Labeling the regions of interest. In the brain MR image (A), the main tissues are GM, WM, and CSF whose probability images are shown in (B–D). Based on the probability images, the gray/white matter boundary (GWB), white matter (WM), gray matter (GM), and background (BG) are labeled. A small part of an axial slice is enlarged as an example of image taking (A). As a gray scale image cannot present enough detail, we have applied jet color-map to display the images. The image (E) is the labeled image with WM, GM, GWB and background according to the probability images.

