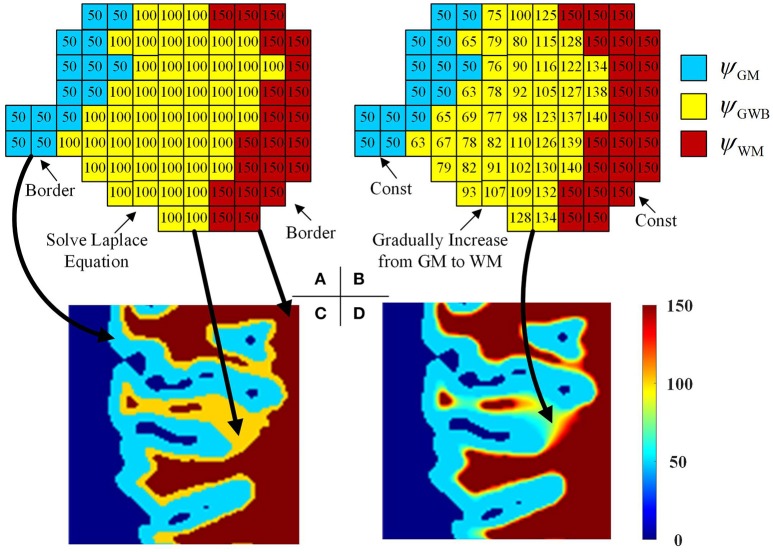
Figure 5.
Images illustrating the generation of the local directions from the labeled image. In the labeled image (A), the values on GWB should be larger than that on GM and smaller than that on WM, e.g., 50 on GM, 100 on GWB and 150 on WM. After obtaining the final local direction images (B), the values within GWB gradually increase from GM to WM, while the values within WM and GM keep const. The example enlarged parts of the real labeled image and the real local direction image are shown as in image (C,D), respectively. All computations are in three dimension, for illustrational convenience, we use two dimensional image to explain the method.

