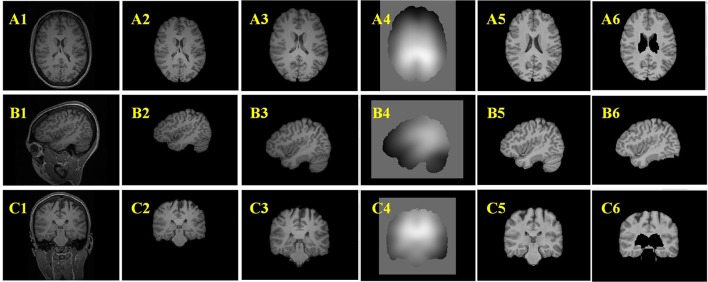
Figure 7.
Example results of the preprocessing procedures. From up to down, the three rows are images of axial view (A), sagittal view (B), and coronal view (C). From left to right, the columns are original images (A1–C1), images after brain extraction (A2–C2), images after registered to Montreal Neurological Institute (MNI) brain space (A3–C3), bias field images (A4–C4), bias field corrected images (A5–C5), images after removing tissues which are not related to FCD lesions (A6–C6).

