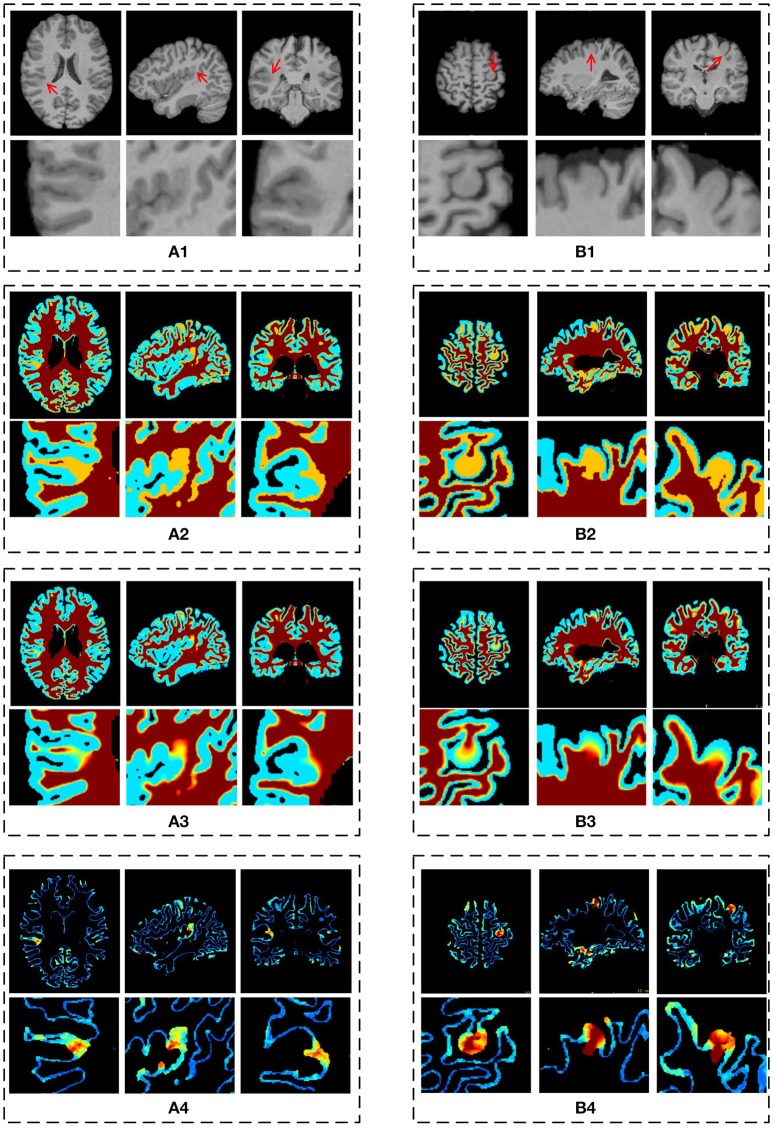
Figure 8.
The results of different stages on GWB width map computation. Images are from two participants denoted by (A,B), respectively. The (A1,B1) are the preprocessed images with lesional regions indicating by red arrows. The (A2,B2) are segmentation images with GWB region. The (A3,B3) are the images with local directions. The (A4,B4) are the GWB width maps. On each dashed box, from left to right, the columns are the image on axial, sagittal, and coronal views. The images on the second line show the enlarged FCD regions [the locations are indicated by red arrows on the first line of (A1,B1)] on the corresponding image on the first line. All the computations are three-dimensional; for convenience, two-dimensional images in different views are presented.

