Figure 9.

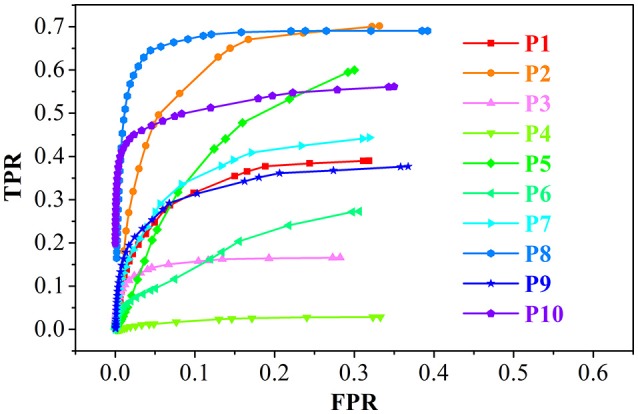
The receiver operating characteristic (ROC) curve analysis of the true positive rate (TPR) and false positive rate (FPR) for the feature images of the GWB width map. P1 means the results of patient number 1.

The receiver operating characteristic (ROC) curve analysis of the true positive rate (TPR) and false positive rate (FPR) for the feature images of the GWB width map. P1 means the results of patient number 1.