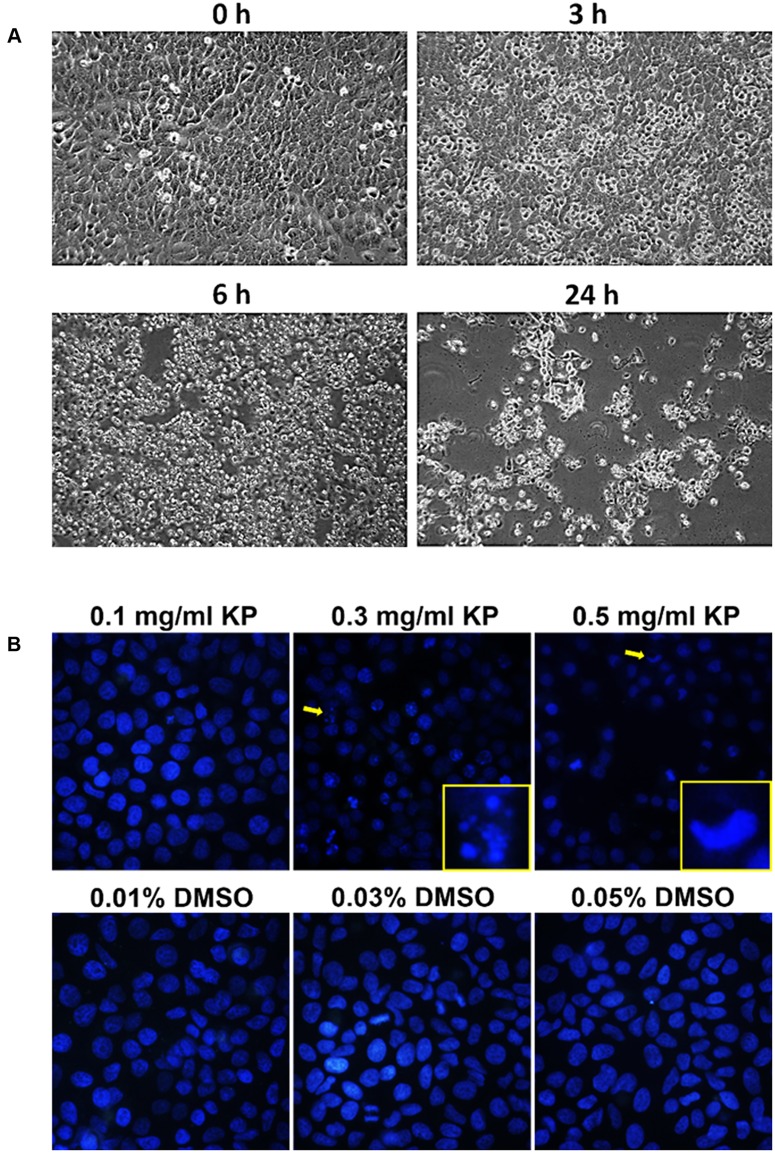
FIGURE 2.
Morphological changes and nuclear fragmentation of HeLa cells exposed to KP extract. (A) Phase-contrast images of HeLa cells treated with 0.5 mg/mL of KP extract taken at different time points (0, 3, 6, and 24 h). (B) The nuclei of HeLa cells treated with KP extract at different concentrations (0.1–0.5 mg/mL) or with DMSO (0.01–0.05%), stained with Hoechst33342, and visualized using a fluorescent microscope. Arrows indicate cells with nuclear fragmentation or nuclear deformity, and magnified views of cells indicated with arrows are shown at the bottom right corners. Data are representative of three replicates.

