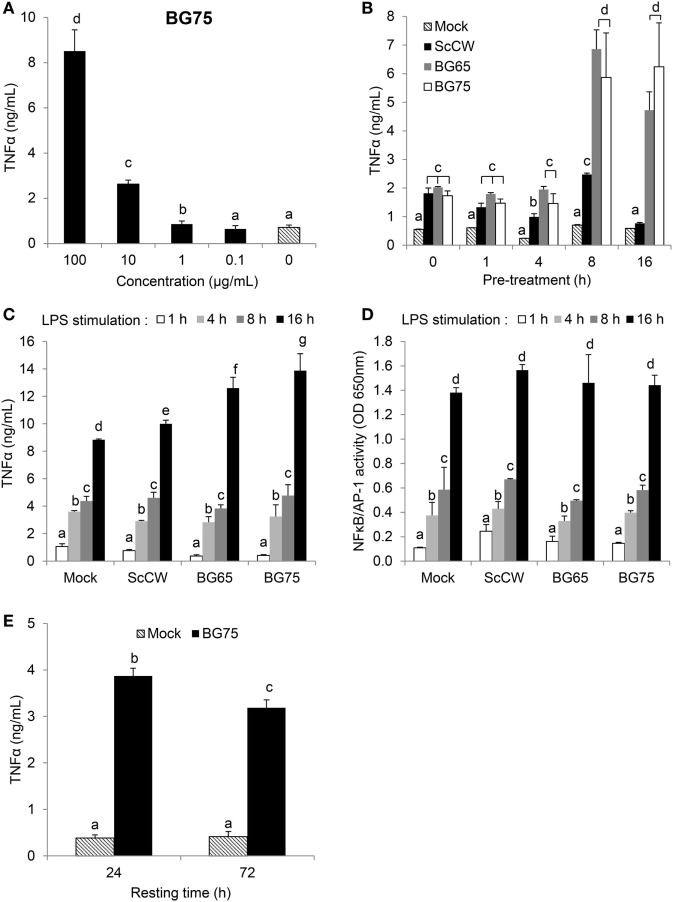
Figure 2.
β-glucans (BGs) prime the production of TNFα in macrophages via a late and dose-dependent mechanism lasting beyond BG incubation. (A,B,E) bone marrow-derived macrophages (BMDM) were subcultured in 96-well plates. (A) Cells were incubated for 8 h with a 10-fold serial dilution from 100 to 0.1 µg/mL of BG75. After supernatant removal, BMDM were then stimulated with 100 ng/mL of ultraPure lipopolysaccharide (LPS) for 16 h. Supernatants were collected at the end of the incubation for further analysis. (B) Cells were stimulated for 1, 4, 8, 16, and 24 h with 100 µg/mL of BG-containing products (ScCW, BG65, and BG75). Supernatants were discarded and 100 ng/mL of ultraPure LPS was added in each well for 16 h incubation. Supernatants were immediately collected and stored at −20°C. TNFα was measured using ELISA and data are expressed as the mean ± SD from two independent experiments performed in triplicate. (C,D) NFκB/AP-1 reporter RAW-Blue™ macrophages were treated with 100 µg/mL of BG-containing compounds for 8 h before stimulation with 100 ng/mL of ultraPure LPS for 1, 4, 8, or 16 h. At the end of the incubation, supernatants were harvested and stored at −20°C until further use. NFκB/AP-1 activity was determined by a colorimetric enzyme assay where cell culture supernatants were incubated with Quanti-Blue™ reagent before reading OD at 650 nm. TNFα was quantified by ELISA. Data are expressed as the mean ± SD from three independent experiments performed in triplicate. (E) BMDM were incubated for 8 h with 100 µg/mL of BG75 or control. After supernatant removal, fresh medium was added for further 24 or 72 h (resting time) and cells were stimulated with 100 ng/mL of ultraPure LPS for 16 h. Supernatants were collected and stored at −20°C. TNFα was measured using ELISA and data are expressed as the mean ± SD from three independent experiments performed in triplicate. Mean values not sharing the same letter are significantly different according to the Student’s t-test (p < 0.05). For (B–D), results of statistical analyses are displayed for comparisons between each compound according to the incubation time.

