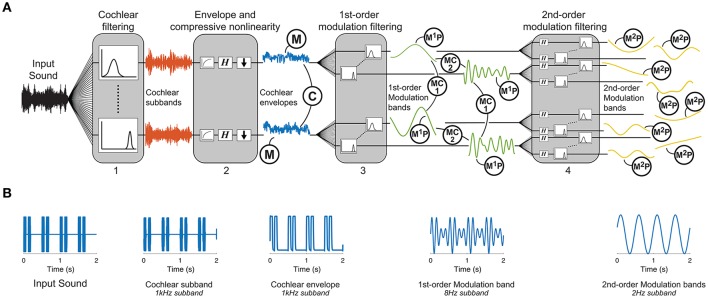
Figure 1.
Texture analysis model. (A) The functional auditory model captures the tuning properties of the peripheral and subcortical auditory system: (1) An auditory filterbank simulates the resonance frequencies of the cochlea, (2) a non-linearity captures the compression of the cochlea followed by a computation of the Hilbert envelope, functionally modeling the transduction from the mechanical vibrations on the basilar membrane to the receptor potentials in the hair cells, (3) a first-order modulation filterbank captures the selectivity of the auditory system to different envelope fluctuation rates, and (4) a second-order modulation filterbank captures the sensitivity of the auditory system to beating in the envelope frequency domain. Texture statistics include marginal moments of cochlear envelopes (M), 1st-order modulation power (M1P), pair-wise correlations between cochlear envelopes (C), pairwise correlations between modulation subbands (MC1), phase correlations between octave-spaced modulation bands (MC2), and 2nd-order modulation power (M2P). (B) Example second-order modulation stimulus. The far-left panel shows the input stimulus that consists of two short 62.5 ms pulses repeated every 500 ms. The example outputs are shown at each stage of the model. The output of the 1st-order modulation band is shown for the 8 Hz subband which captures the period of the short pulses. The 2nd-order modulation band is shown for the 2 Hz subband which captures the period of the repetition.

