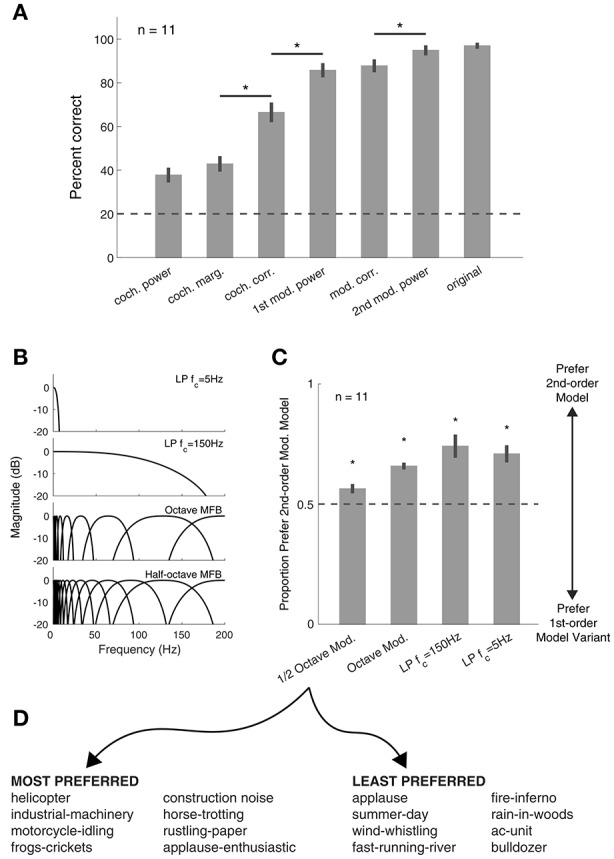
Figure 5.

Synthetic texture identification and preference tasks. (A) Identification of sound textures improves with the inclusion of more statistics. Asterisks denote significant differences between conditions, p < 0.01 (paired t-tests, corrected for multiple comparisons). Error bars here and elsewhere show the standard error. Dashed lines here and elsewhere show chance performance. (B) Modulation filter(bank) structure used in the listening experiments. For low-pass (LP) conditions, only the statistics of the signal in the passband were modified. (C) Sounds synthesized with the 2nd-order modulation statistics were preferred over all other auditory texture models. Asterisk denotes significance from chance (p < 0.01). (D) Eight most preferred (left) and least preferred (right) textures from experiment 2, relative to first-order modulation filterbank model (half-octave spacing).
