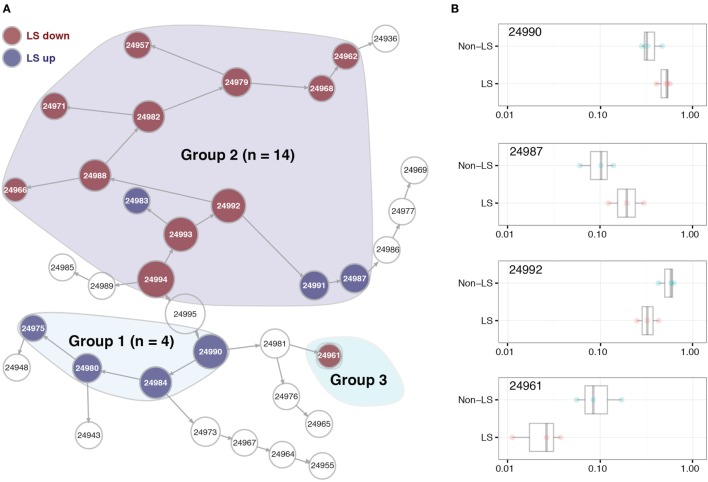
Figure 1.
Significant differences in CD4+ T cell patterns between Löfgren’s syndrome (LS) and non-LS. (A) Citrus network tree visualizing the hierarchical relationship between identified bronchoalveolar lavage fluid CD4+ T cell populations in LS (n = 4) and non-LS (n = 4). Circle size reflects number of cells within a given cluster. Clusters differing significantly in abundance between the two conditions are divided into three main groups (highlighted). Populations more abundant in LS are indicated in blue, while those more abundant in non-LS are marked in red. (B) Citrus-generated box plots for four representative and differentially regulated populations in LS and non-LS, illustrative of all three cluster groups shown in panel (A). Cluster abundances are shown on a logarithmic scale for clusters 24990, 24987, 24992, and 24961, respectively, annotated according to panel (A). All differences in abundance are significant at FDR < 0.25.

