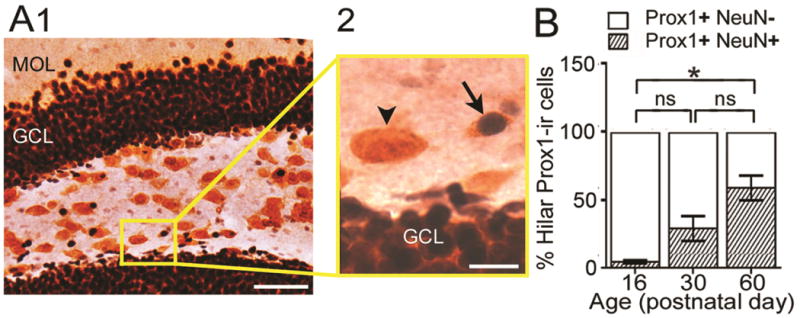
Figure 2. The subset of hilar Prox1-ir cells in C57BL/6J mice that co-expressed NeuN increase with age.

A. Example of Prox1-ir and NeuN-ir double-labeling.
1. Low power. The boxed area is shown at higher power in A2. MOL = molecular layer; GCL = granule cell layer. Calibration = 50 μm.
2. The arrow points to a double-labeled cell with a dark Prox1 nucleus surrounded by NeuN-stained cytoplasm (diffuse orange staining, corresponding to NovaRed as described in the Methods). The arrowhead points to a Prox1-ir cell that was not double-labeled with NeuN. Calibration = 10 μm.
B. Percentage of Prox1-ir cells that did (shaded bars) or did not (white bars) co-express NeuN at PND16, 30 and 60 (n = 3/group). A one-way ANOVA was significant [F (2, 6) 15.52; p = 0.04]. There was a significant difference between PND16 and PND60, with PND16 showing fewer double-labeled cells (post-hoc tests, p < 0.05). PND30 mice did not significantly differ from PND16 or PND60 mice (post-hoc tests, p > 0.05). ns = not significant.
