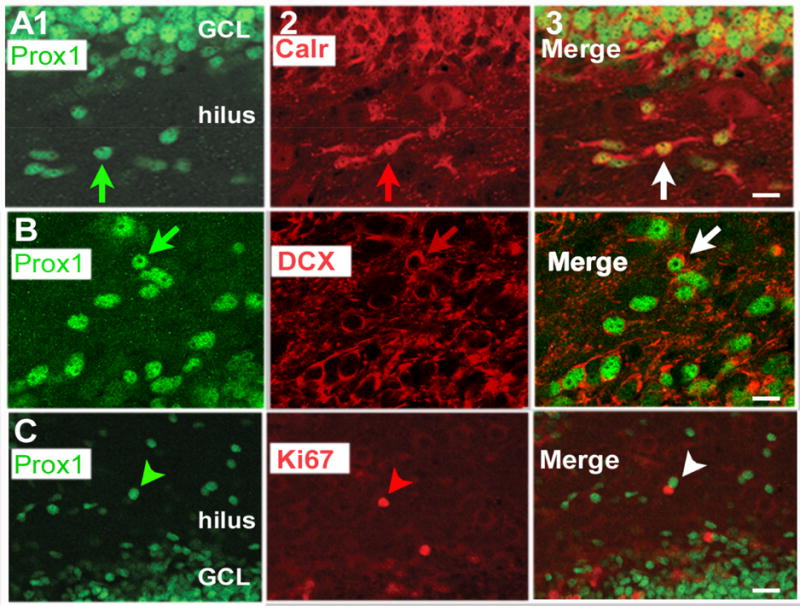
Figure 3. Most hilar Prox1-ir cells at PND16 in C57BL/6J mice co-express calretinin or DCX but not Ki67.

A. 1. Prox1 (green) staining in a section from a PND16 mouse.
2. The same section, showing calretinin (red) staining.
3. The merged image shows cells that are double-labeled in yellow (white arrow). GCL = granule cell layer. Calibration in A3 = 15 μm. Additional images are shown in Supplemental Figure 4 and Supplemental Movie 1.
B. 1. Prox1 (green) staining in a section from a PND16 mouse.
2. The same section, showing DCX (red) staining.
3. The merged image shows cells that are double-labeled have a green center reflecting the nuclear Prox1 stain and red processes reflecting DCX expression (white arrow). In some cases DCX is expressed in the cytoplasm (red arrow in B2). Calibration in B3 = 10 μm. Additional images are shown in Supplemental Figure 5.
C. 1. Prox1 (green) staining in a section from a PND16 mouse.
2. The same section, showing Ki67 (red) staining.
3. The merged image shows cells that are green or red (arrowhead) but no evidence of cells that are double-labeled. Calibration in C3 = 20 μm.
