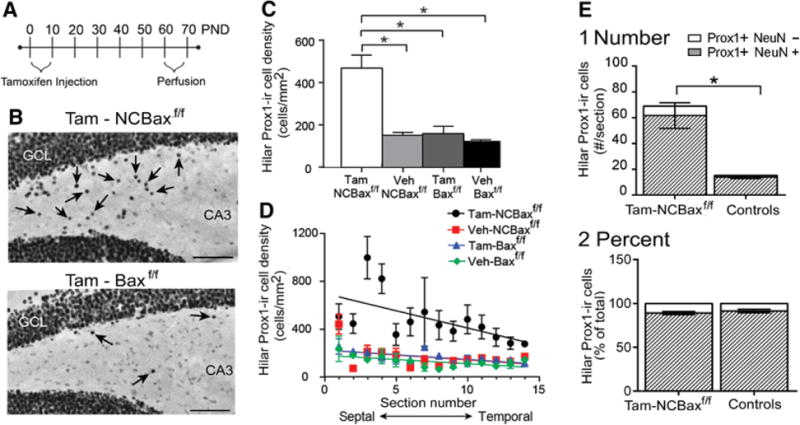
Figure 5. Selective deletion of BAX in Nestin-expressing cells increases hilar Prox1-ir cell density.

A. A schematic illustrates the experimental timeline for tamoxifen injections (daily, PND2-8) and perfusions (PND63-66).
B. An example of Prox1-ir for a section in a tamoxifen-treated NCBaxf/f mouse where there are numerous hilar Prox1-ir cells (Top, arrows) vs. a section from a tamoxifen-treated Baxf/f mouse where there are few Prox1-ir cells (Bottom). Sections are from a similar septotemporal level. GCL = granule cell layer. Calibration = 75 μm.
C. One-way ANOVA showed that tamoxifen-treated NCBaxf/f mice had significantly greater hilar Prox1-ir cell density compared to all other groups [one way-ANOVA; F (3, 8) 23.50; p = 0.0003 followed by post-hoc tests, p < 0.05; asterisks]. Veh = vehicle.
D. Hilar Prox1-ir cell density is plotted along the septotemporal axis.
E. The number of Prox1-ir cells that were double-labeled with NeuN (shaded), and the number of Prox1-ir cells without NeuN co-expression (white) are shown for tamoxifen-treated NCBaxf/f mice (n=3) and vehicle-treated mice (NCBaxf/f and Baxf/f, mice, pooled, n = 3).
1. Tamoxifen-treated mice had more double-labeled cells than vehicle-treated mice (Student’s t-test, p = 0.009).
The percentage of double-labeled cells did not significantly differ (Student’s t-test, p = 0.431).
