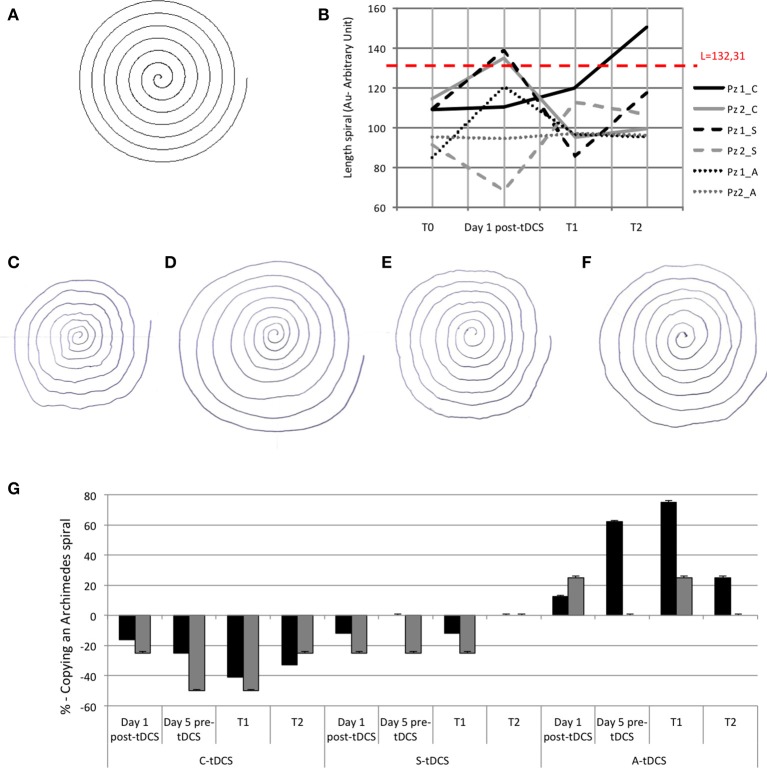
Figure 2.
(A) Copy of an Archimedes spiral task: template of Archimedean Spiral; (B) The lines show quantitative evaluation in both patients at T0, at day 1 after tDCS, at T1, and at T2. The red dashed line is the length of the sample spiral (132.31 mm), black lines refer to patient 1 and gray lines to patient 2. The full is C-tDCS, the dashed line is A-tDCS and the dotted line s S-tDCS session; (C) Copy of Archimedean Spiral the first day after C-tDCS treatment in patient 1; (D) Copy of Archimedean Spiral at T1 of the C-tDCS session in patient 1; (E) Copy of Archimedean Spiral at the first day after A-tDCS treatment in patient 1; (F) Copy of Archimedean Spiral at T1 of the A-tDCS session in patient 1. (G) The histogram shows tremor in qualitative analysis in the percentage differences after tDCS in both patients. 0% is baseline (pre-tDCS—T0).

