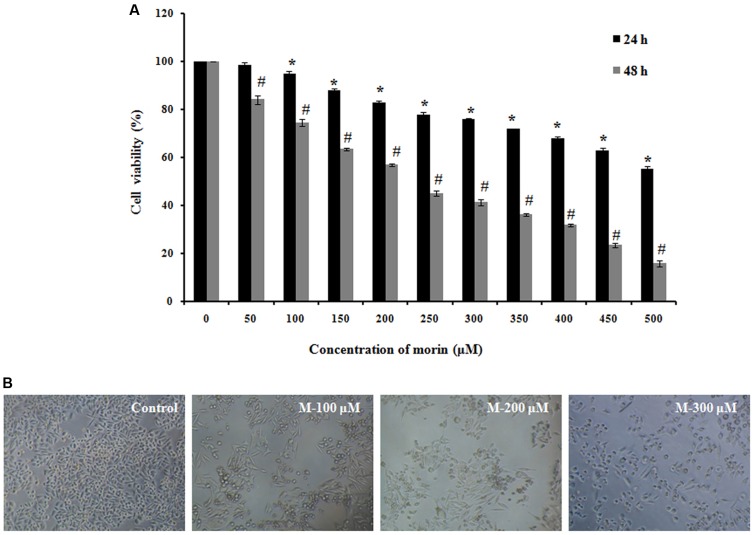
FIGURE 1.
Morin induces cytotoxicity in SW480 colon cancer cells. (A) SW480 cells were treated with various concentrations of morin (50–500 μM) for 24 and 48 h. Cell viability was measured sing MTT assay. Results are shown as percentage reduction in cell viability of treated cells compared to untreated control cells. Values shown are the means ± SD obtained from three independent experiments. (B) Representative images when taken using phase contrast microscope. CAPT: camptothecin (50 μM), M (100, 200, and 300 μM): Morin (100, 200, and 300 μM). Significance levels between different groups were determined by using one way ANOVA, followed by Duncan’s multiple range test ∗p ≤ 0.05 versus control, 24 h; #p ≤ 0.05 versus control 48 h.

