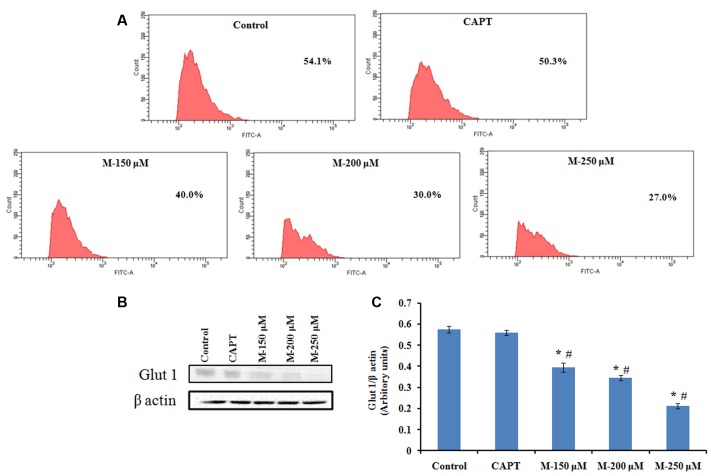
FIGURE 10.
Flow cytometry analysis of 2-NBDG uptake and western blot analysis for Glut 1 expression. SW480 cells were treated with various concentrations of morin (150, 200, and 250 μM) and camptothecin (50 μM) for 48 h. (A) FACS analysis of 2-NBDG uptake in SW480 cells plotting cell count against FITC. (B) Glut 1 expression analyzed by western blotting. (C) Quantification of Glut 1 protein levels. CAPT: camptothecin (50 μM), M (150, 200, and 250 μM): Morin (150, 200, and 250 μM). Each value represents mean ± SD (standard deviation) from three independent experiments. Significance levels between different groups were determined by using one way ANOVA, followed by Duncan’s multiple range test. ∗p ≤ 0.05 versus control, #p ≤ 0.05 versus camptothecin.

