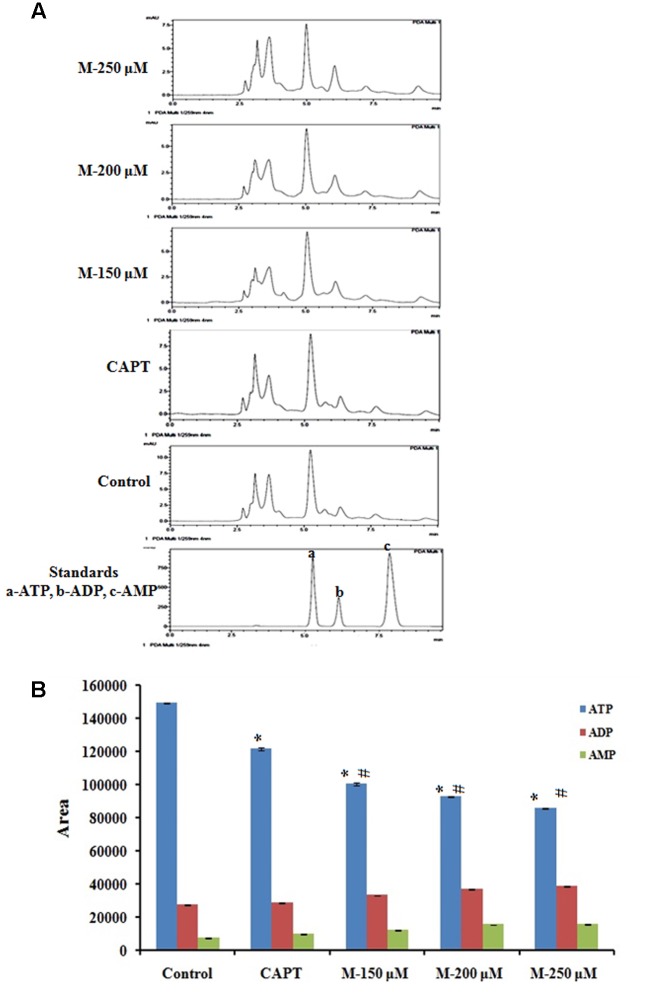
FIGURE 9.
Quantification of ATP level by HPLC method. SW480 cells were treated with various concentrations of morin (150, 200, and 250 μM) and camptothecin (50 μM) for 48 h. Morin treatment significantly decreases mitochondrial capacity to produce ATP. (A) Representative HPLC chromatogram showing decrease in ATP production in SW480 cells on treatment morin. (B) Graphical representation of reduction in ATP production by morin in SW480 colon cancer cells. CAPT: camptothecin (50 μM), M (150, 200, and 250 μM): Morin (150, 200, and 250 μM). Each value represents mean ± SD from triplicate measurements and significance levels between different groups were determined by using one way ANOVA, ∗p ≤ 0.05 versus Control; #p ≤ 0.05 versus camptothecin.

