
FIGURE 3.
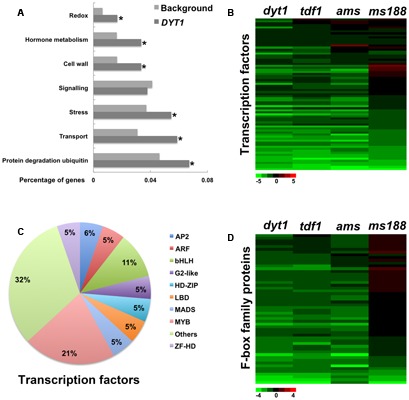
Functional analysis of DYT1-specific genes. (A) GO enrichment analysis of DYT1-specific genes. (B) Heat map of mRNA expression profiles of transcription factors of DYT1 in dyt1, tdf1, ams, and ms188 mutants. Green and red colors represent lower and higher log2 fold change of expression in mutants compared with the wild type. (C) Subsets in DYT1-specific transcription factors. (D) Heat map of mRNA expression profiles of F-box family proteins of DYT1 in dyt1, tdf1, ams, and ms188 mutants. Green and red colors represent lower and higher log2 fold change of expression in mutants compared with the wild type. Asterisk indicates P values < 0.05 compared with background.