
FIGURE 6.
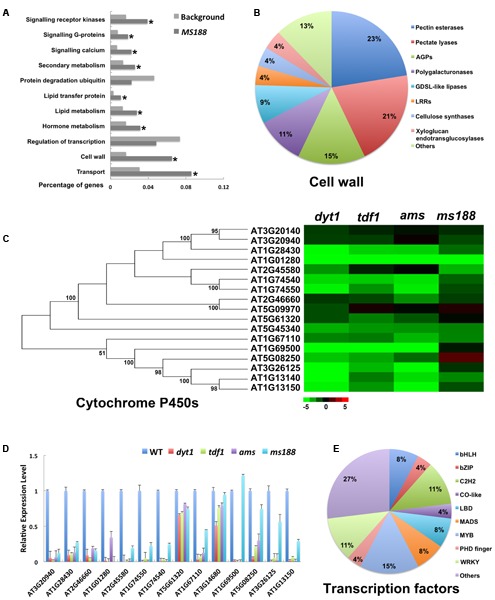
Functional analysis of commonly expressed genes down-regulated in the four mutants. (A) GO enrichment analysis of common genes. (B) Subsets of cell wall related genes in common genes. (C) Heat map of mRNA expression profiles of cytochrome P450 family genes in dyt1, tdf1, ams, and ms188 mutants. (D) Q-RT-PCR analysis of the cytochrome P450 family genes. (E) Subsets of transcription factors in common genes. Asterisk indicates P values < 0.05 compared with background.