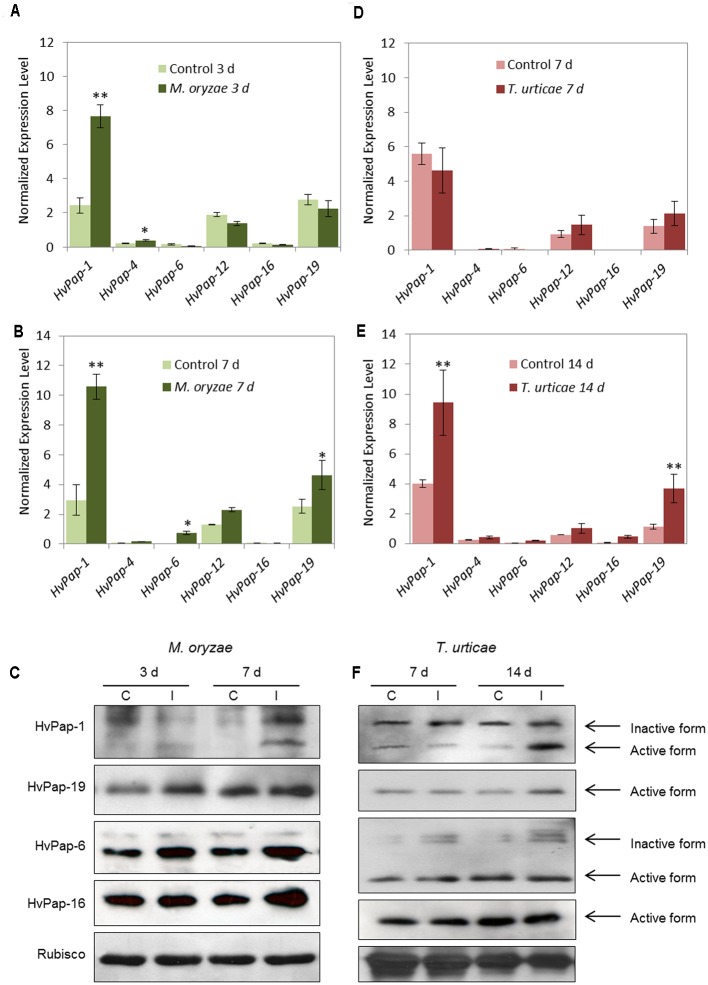
FIGURE 2.
mRNA expression levels of barley C1A CysProt genes after M. oryzae infection and T. urticae infestation. Expression of barley CysProt genes (HvPap-1, -4, -6, -12, -16 and -19) in M. oryzae infected (dark green) and non-infected (light green) barley leaves at (A) 3 days and (B) 7 days of treatment, and in T. urticae infested (dark red) and non-infested (light red) barley leaves at (D) 7 days and (E) 14 days of treatment. Data were determined by RT-qPCR and expressed as mRNA levels of C1A CysProt genes normalized to barley cyclophilin mRNA content. One (∗) or two asterisks (∗∗) indicate significant differences between control and treatment as determined by a one-way ANOVA test (t-Student, P < 0.01 and P < 0.001, respectively). Protein accumulation patterns of barley C1A CysProt (HvPap-1, -19, -6 and -16) after (C) M. oryzae infection and (F) T. urticae infestation assayed by immunoblot. Proteins were extracted from barley leaves at 3, 7, and 14 d of infection/infestation (I), and non-infection/infestation (C) treatments. Bands corresponding to inactive and active forms of CysProt are indicated by arrows. Rubisco protein expression was analyzed using a specific antibody against its large subunit.

