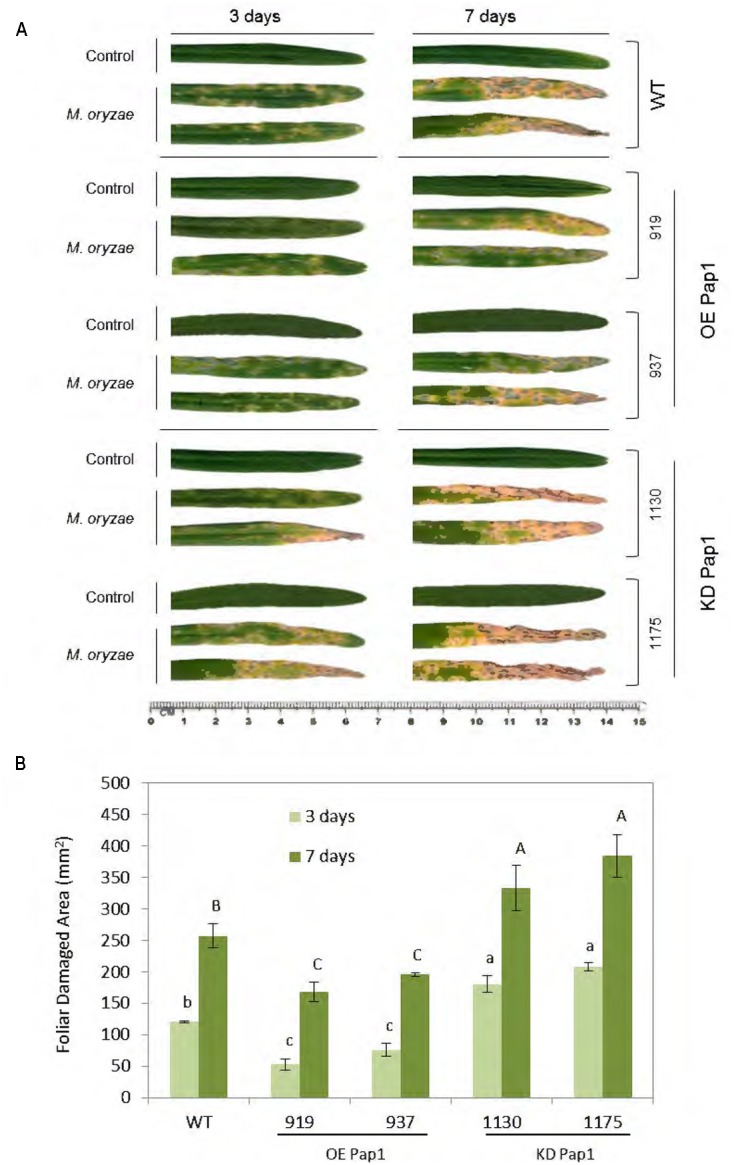
FIGURE 3.

Images of the oldest leaf of transgenic and wild-type barley lines during M. oryzae attack, along 3 and 7 days of infection treatment or non-infection as control. (A) Leaves from HvPap-1 overexpressing lines (OE Pap1, 919 and 937), silencing lines (KD Pap1, 1130 and 1175) and wild-type (WT) plants. (B) Quantification of leaf damage on barley transformed (OE Pap1and KD Pap1) and non-transformed (WT) plants, after 3 (light green) and 7 (dark green) d of M. oryzae infection. Damage was measured as mm2 of injured foliar area and is represented as mean ± SE of seven old leaves measurements from seven independent plants per treatment. Different letters indicate significant differences (P < 0.01, one-way ANOVA Student Newman–Keuls test).
