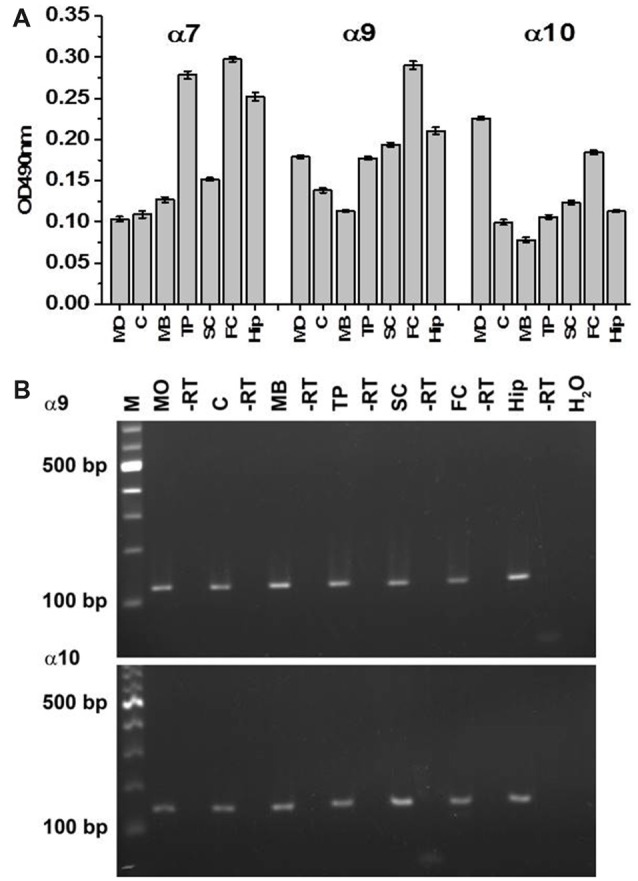
Figure 3.

Sandwich ELISA (A) and RT-PCR (B) of various brain regions of the WT mice. In (A), the brain samples were captured with α7(1–208)-specific antibody and revealed with α7(179–190)-, α9(190–200)- or α10(404–417)-specific antibodies. Each column corresponds to M ± SE of data obtained from five mice per brain region. MO, medulla oblongata; C, cerebellum; MB, midbrain; TP, thalamus and putamen; SC, somatosensory cortex; FC, frontal cortex; Hip, hippocampus; -RT negative control where no enzyme was used during cDNA synthesis, H2O, negative control where water was used instead of cDNA; M, marker; bp, base pair.
