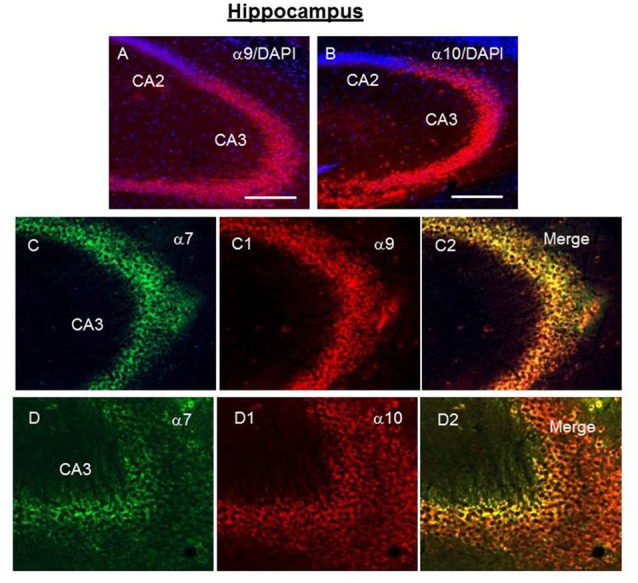
Figure 5.

Immunochemical staining of the CA2-CA3 regions of hippocampus of the WT mouse. Green—α7-specific, red—α9- or α10-specific staining, blue—DAPI (cell nuclei) with α9- or α10-selective antibody and DAPI (A,B) and with α7- and α9-selective (C,C1,C2) or α7- and α10-selective antibodies (D,D1,D2). (A,B) Bar is 200 μm; (C,D) bar is 100 μm.
