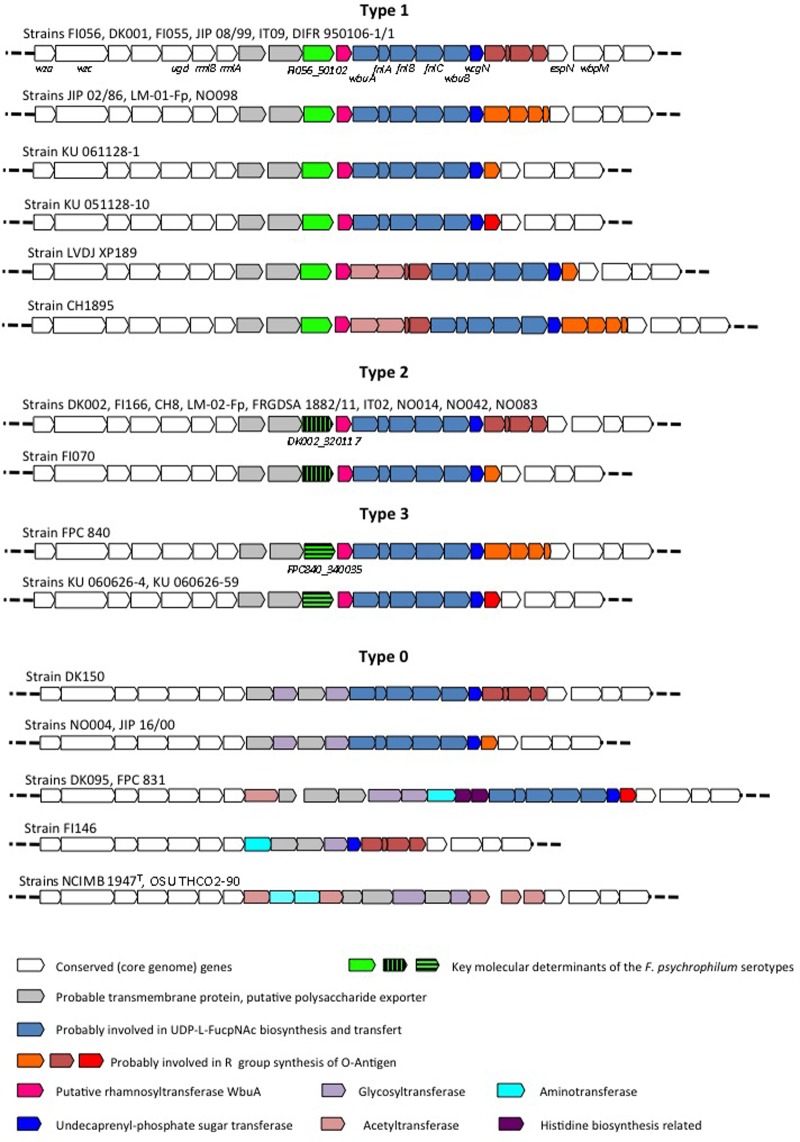
FIGURE 2.
Genomic organization of the polysaccharide encoding loci. The polysaccharide encoding loci were analyzed using the Microscope platform. Gene conservation was predicted using both homology and synteny criteria. White arrows represent core genome genes (i.e., genes conserved in the whole genome dataset which deduced proteins display >80% identity over >80% coverage) and colored arrows represent genes belonging to the variable genome (i.e., genes not conserved in the whole genome dataset).

