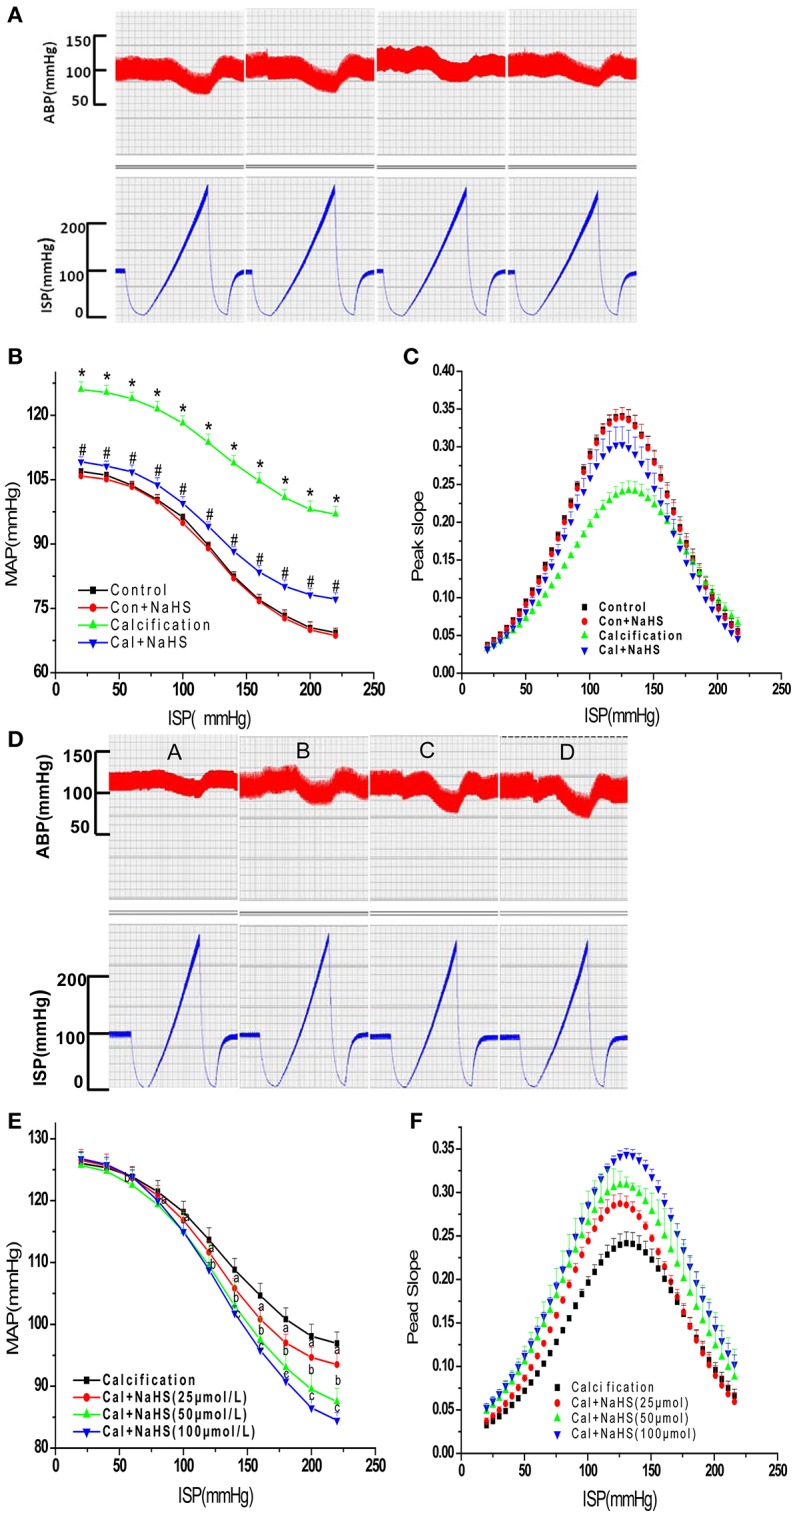
Figure 4.

The original recording images (A,D), functional curves (B,E) and peak slope (C,F) of carotid sinus baroreflex. (A–C), Effect of chronic NaHS treatment on baroreflex; (D–F), Effect of acute NaHS treatment on baroreflax. Data are mean ± SD. *P < 0.05 vs. control; #P < 0.05 vs. Cal. (n = 8 each group).
