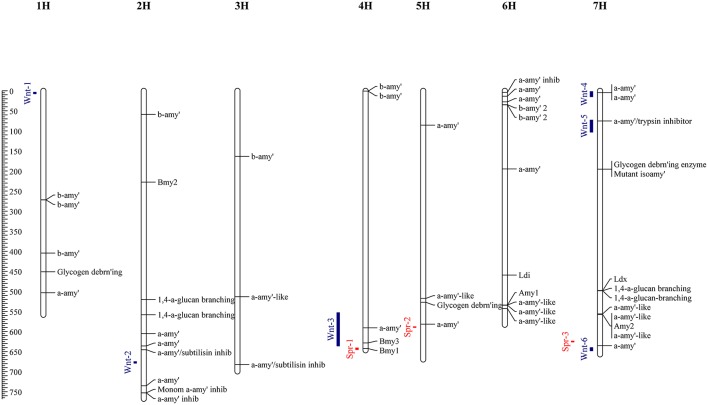
Figure 2.
Physical map locations (Mbp) of QTL identified by allele frequency differences between high and low DP sets. Associations identified from the spring set are indicated by red bars, and the winter set as blue bars. Genes identified (by homology) from the barley reference sequence with putative (or known) diastase function are indicated along with functional descriptions or gene names for known barley diastase genes.

