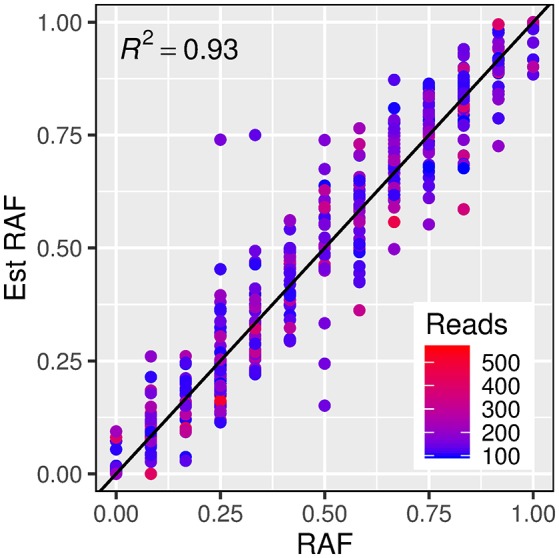
Figure 3.

Relationship between estimated reference allele frequencies (y axis) and true reference allele frequency (x axis) from exome capture reads and iSelect 9k genotypes respectively. The dashed line represents a “one to one” linear relationship and the R2-value indicates the proportion of the variance in the estimated allele frequency accounted for by this model. The color of the points indicates the read count for each estimated frequency.
