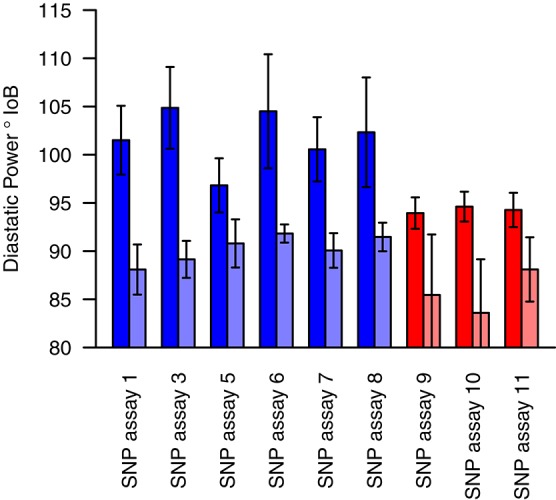
Figure 4.

Mean diastatic power of varieties carrying either the high (dark shades) or low (light shades) allele at each of the candidate markers. Blue bars indicate SNPs identified from the winter sets, and red bars those from the spring sets. Error bars indicate the standard error in the mean.
