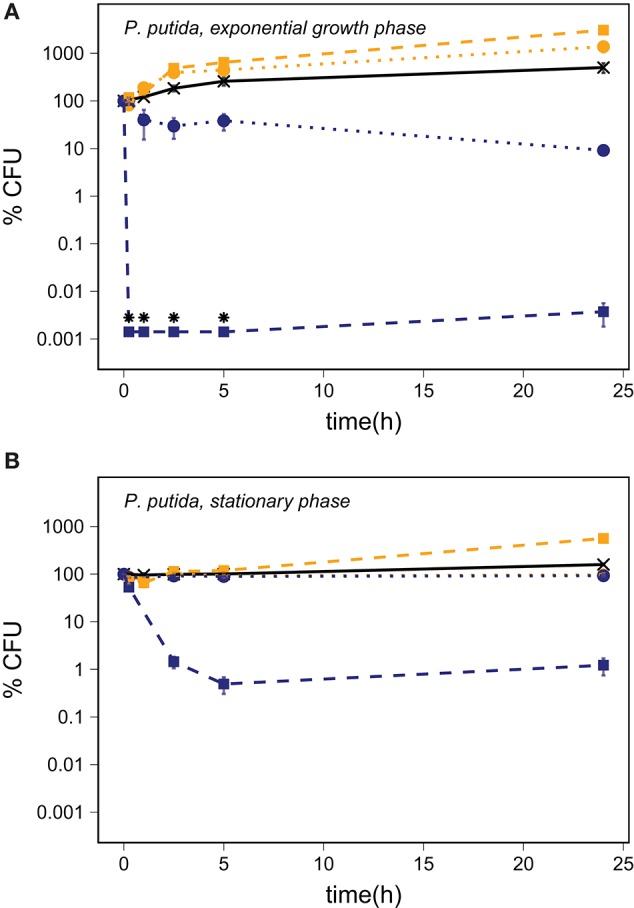
Figure 2.

The percentage of CFU of P. putida harvested in the exponential growth phase (A) and in the stationary phase (B) in a PBS control (—X—) and after addition of abraded quartz ( ) and basalt (
 ) relative to the starting concentration of ~106 CFU/ml. The survival of P. putida is shown for experiments with inactivated silicates (orange) and abraded silicates kept anoxic (blue). The error bars show the SEM, and the asterisks indicate that the number of CFU was below the LOD.
