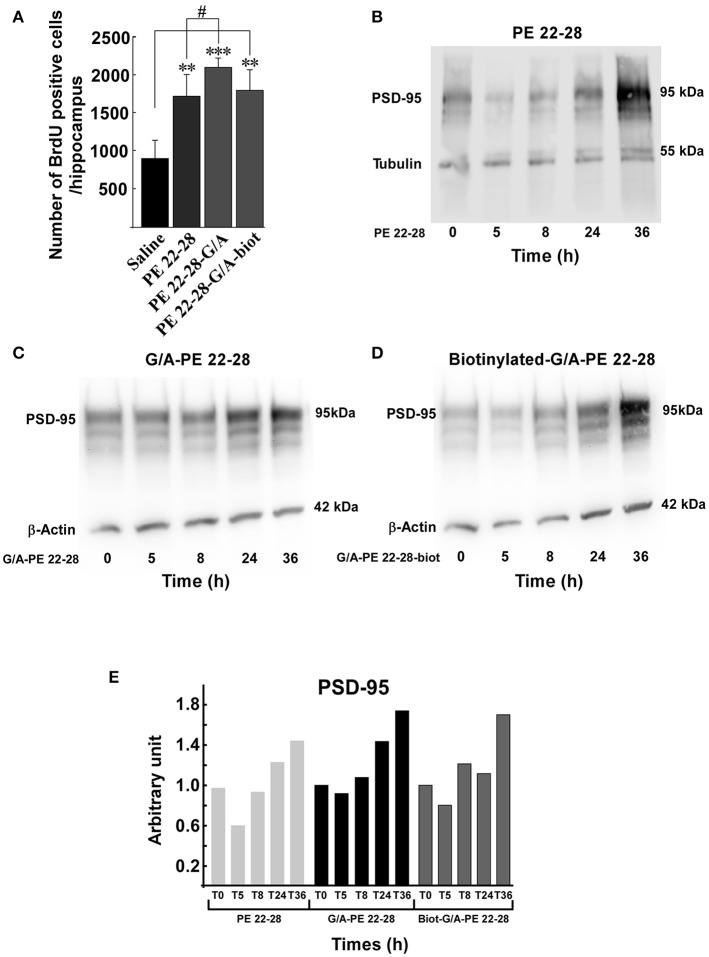
Figure 6.
Neurogenesis and synaptogenesis. (A) Neurogenesis was assessed by measuring the number of BrdU positive cells per hippocampus after sub-chronic treatments (3.0–4.0 μg/kg, 4 days) with spadin-analogs. The cell number was given for the entirety of hippocampus. **p < 0.01, ***p < 0.001, #p < 0.05. (B–D) Synaptogenesis was assessed by measuring the increase in the level of PSD-95 in mouse cortical neuron. Mouse cortical neurons were treated with 0.1 μM of the indicated spadin-analog PE 22-28 (B), G/A-PE 22-28 (C) and biotinylated-G/A-PE 22-28 (D). At the indicated times neurons were homogenized in Laemmli buffer and submitted to Western blot analysis. (E) Histogram illustration of the PSD-95. For each spadin-analog, the PSD-95 amount at 36 h was about twice than that measured at 5 h.

