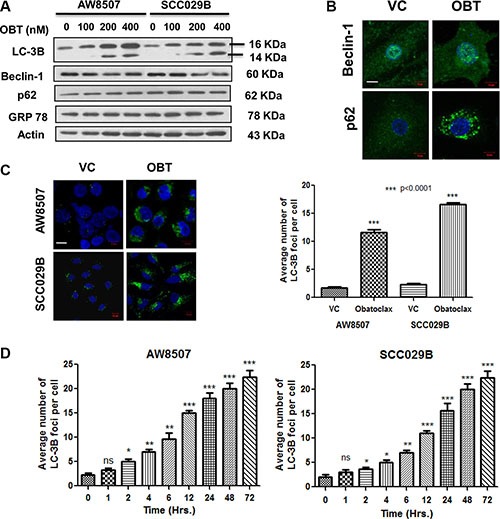
Figure 3. Obatoclax induces autophagy in OSCC cells.

(A) Autophagy induction in OSCC cells is evident from appearance of LC-3BII band when treated with increasing doses of Obatoclax for 24 hours. Beclin-1, p62 and GRP78 levels did not show significant alterations. (B) SCC029B cells were either treated as vehicle control (VC) or with 400 nM Obatoclax (OBT) for 24 hours and endogenous Beclin-1 and p62 were detected by immunofluorescence staining (Scale bar: 10 μm). (C) Quantitation of autophagy. AW8507 and SCC029B cells were either treated as vehicle control or with 400 nM Obatoclax for 24 hours and endogenous LC-3B was detected by immunostaining. The average number of LC-3B foci were scored in the Obatoclax treated and control cells (Scale bar: 10 μm). (D) A time course study of autophagy induced by Obatoclax. AW8507 and SCC029B cells were exposed to 400 nM Obatoclax for different time points and the average number of LC-3B foci per cell were detected as mentioned above. The data is represented as mean ± SEM of three independent experiments. The images are representative of three independent trials.
