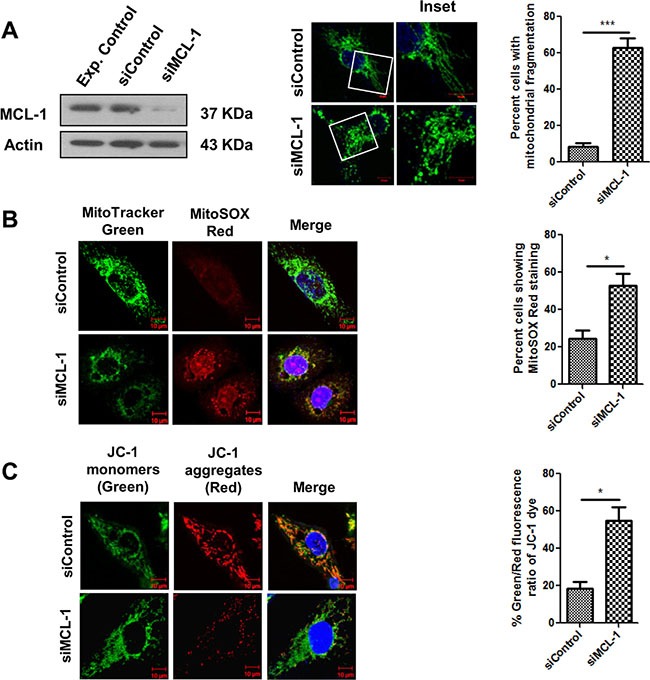
Figure 9. MCL-1 downregulation induces mitochondrial stress in SCC029B cells.

SCC029B cells were transfected with 50 nM control siRNA and 50 nM MCL-1 siRNA. 48 hours post transfection, cells were used for experimental analysis. (A) The cell lysates were subjected to western blotting for MCL-1 and β-actin. Alternatively, the siRNA transfected cells were immunostained for HSP60 and observed under a confocal microscope. The percentage of cells showing mitochondrial fragmentation was determined as described earlier. (B) The siRNA transfected cells were stained with MitoTracker green, MitoSOX Red and Hoechst dyes and observed under a confocal microscope. (C) The siRNA transfected cells were stained with JC-1 dye and analyzed for change in percent green to red fluorescence intensity ratio of JC-1 dye as discussed earlier. Data is represented as mean ± SEM of three independent experiments (Scale bar: 10 μm). Images are representative of three independent experiments.
