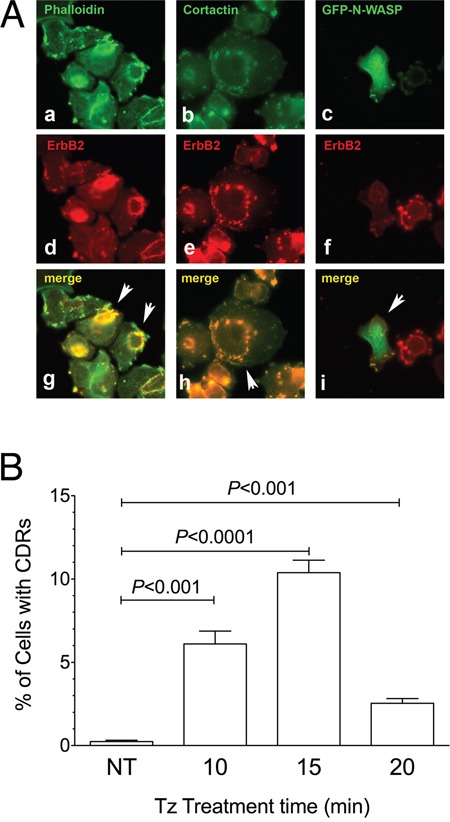
Figure 2. Cortactin and N-WASP are recruited on Circular Dorsal Ruffles (CDRs) that are transient PM structures induced by Trastuzumab (Tz).

(A) SK-BR-3 were treated with Tz for 15 minutes, fixed and processed for immunofluorescence. (a) F-Actin stained with fluorescent phalloidin; (b) Cortactin revealed with a specific antibody; (c) N-WASP:GFP chimera revealed in the green channel; (d, e, f) ERBB2 detected with anti-ERBB2 antibody. Arrowheads indicate colocalization of F-actin, cortactin and N-WASP:GFP green signals with ERBB2 red signals in CDRs (g, h, i). Scale bars = 10 μm. (B) Quantification of Tz-induced CDR formation in SK-BR-3 control cells (NT) and SK-BR-3 cells treated with Tz at various time points indicated in min. Bars represent the average ± SD of the data pooled from 3 independent experiments. At each time point at least 500 cells were analyzed.
