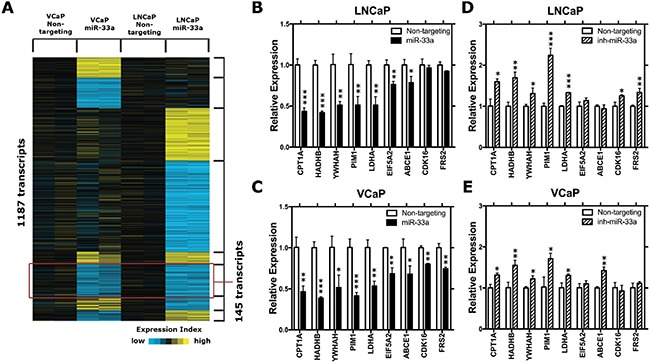
Figure 4. MiR-33a target genes.

(A) The heat-map representation of differentially expressed genes in miR-33a transfected LNCaP and VCaP cells. (B) QRT-PCR validation of selected potential miR-33a target genes in miR-33a mimic transfected (B) LNCaP and (C) VCaP cells and in miR-33a inhibitor transfected (D) LNCaP and (E) VCaP cells compared to the control cells. mRNA levels were normalized to β-actin. Mean +/− SEM is shown for B–E; *P < 0.05, **P < 0.01, ***P < 0.001; t-test.
