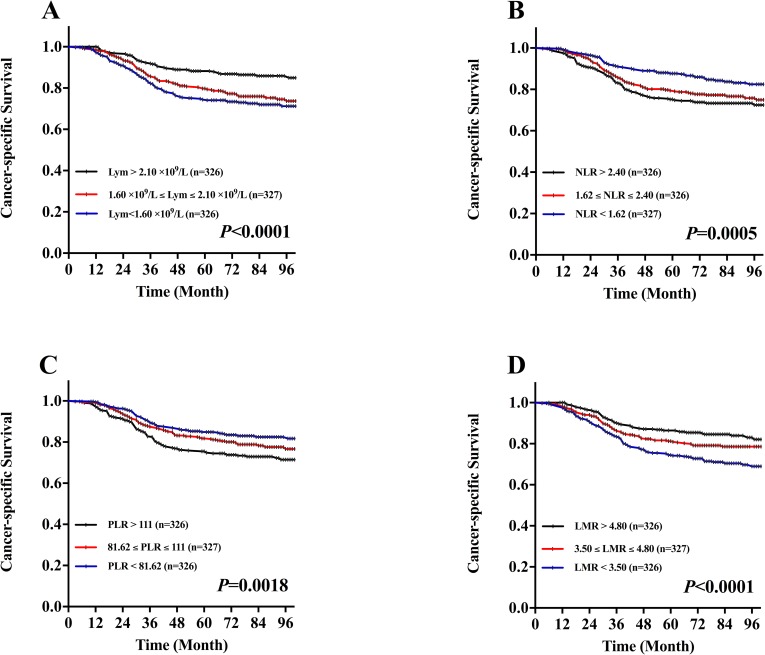
Figure 2. Kaplan-Meier CSS curves stratified by the tertile distribution in terms of lymphocytes (Lym), neutrophil-to-lymphocyte ratio (NLR), platelet-to-lymphocyte ratio (PLR) and lymphocyte-to-monocyte ratio (LMR).
A. CSS curves stratified based on lymphocyte count category. B. CSS curves stratified based on NLR category. C. CSS curves stratified based on PLR category. D. CSS curves stratified based on LMR category.

