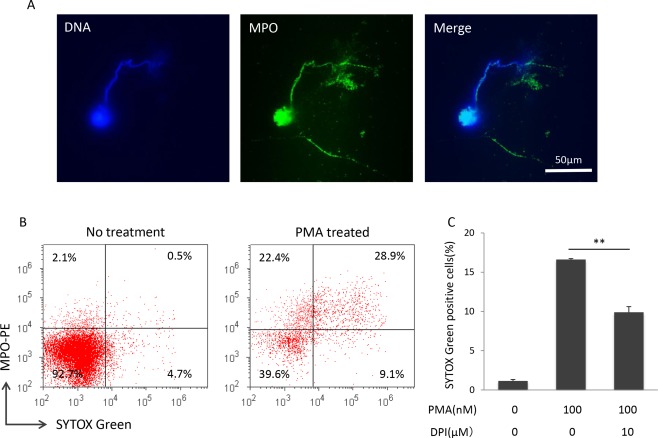
Figure 2.

Evidence of SYTOX Green‐positive cells as neutrophils that formed NETs. (A) Co‐localization of MPO and plasma membrane‐appendant DNA of PMA‐treated neutrophils (100 nM for 4 h). Blue, DNA; Green, MPO. Bar: 50 µm. Similar findings were reproduced in experiments repeated twice. The representative result is shown. (B) Double staining of MPO and SYTOX Green. PMNs without and with PMA treatment (100 nM for 4 h) were subjected to flow cytometry. Similar findings were reproduced in experiments repeated 3 times. The representative result is shown. (C) ROS‐dependent increase in SYTOX Green‐positive cells induced by PMA. Prior to PMA treatment, PMNs (1 × 10⁶/ml) were exposed to 0 or 10 µM NADPH oxidase inhibitor, DPI, for 30 min. The cells were then exposed to 0 or 100 nM PMA for 4 h. Flow cytometric detection of SYTOX Green‐positive cells was carried out. Data are shown as mean ± SD of the percentage of positive cells on SYTOX Green staining. **P < 0.01, n = 3.
