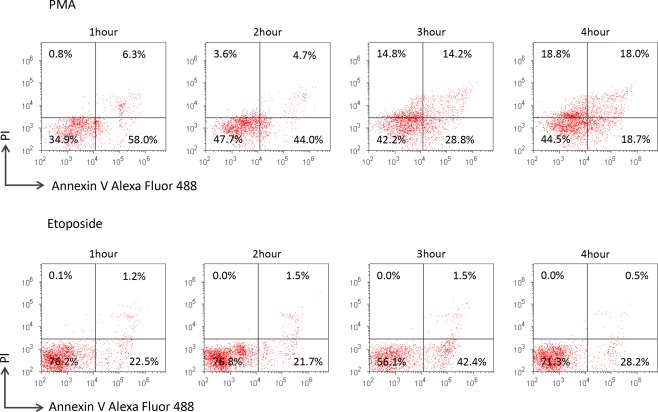
Figure 3.

Difference in phenotype between PMA‐treated neutrophils and etoposide‐treated neutrophils. PMNs were exposed to 100 nM PMA or 100 µM etoposide for 1–4 h. The cells were made to react with Alexa Fluor 488‐conjugated annexin V and PI in the Dead Cell Apoptosis Kit according to the manufacturer's instruction and were subsequently subjected to flow cytometry. Similar results were reproduced in experiments repeated 3 times. The representative result is shown.
