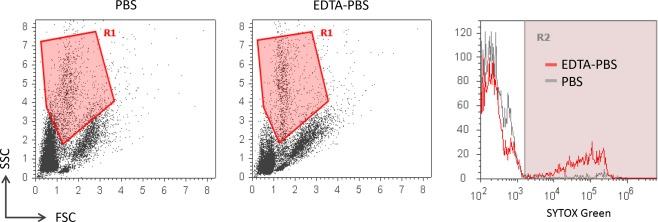
Figure 6.

Detection of NETs formed in vivo. Peritonitis was induced in Wistar rats (6–8 weeks old, female) by i.p. injection of 3% thioglycollate (n = 6). After 72 h, infiltrated cells were collected by washing out the abdominal cavity with PBS or EDTA‐PBS and then resuspended in each buffer (1 × 10⁶/ml) (n = 3 in each group). Flow cytometric detection of SYTOX Green‐positive cells was carried out. The left and middle panels show the representative dot plots of the cells extracted from the inflamed abdominal cavity using PBS and EDTA‐PBS as buffers, respectively. The right panel shows the representative SYTOX Green histograms of cells in R1 that covers neutrophils. Similar results were reproduced in other 2 sets of experiments.
