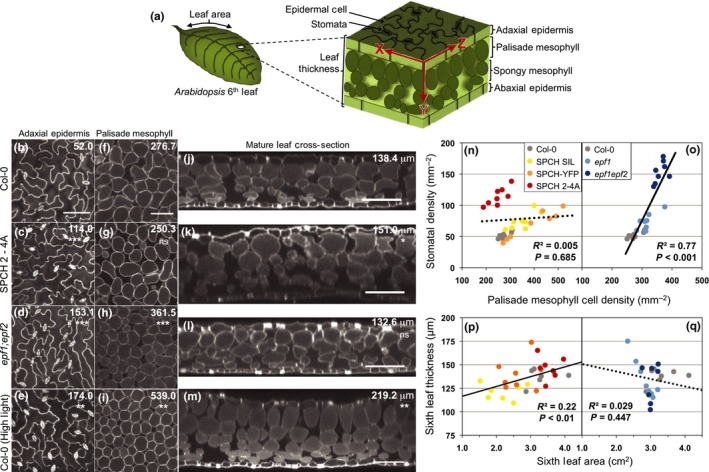
Figure 2.

High‐resolution three‐dimensional imaging of leaf morphology reveals two separate classes of mesophyll alterations in stomatal development mutants. Images of Arabidopsis thaliana (b–e) depict an x–z planar view of the adaxial epidermis (see panel (a) for spatial relationships); all images of the epidermis are at the same magnification. (f–i) An x–z planar view of the palisade mesophyll cell layer; all images of the mesophyll are at the same magnification. (j–m) An x–y planar cross‐section of the mature leaf. Bars, 100 μm. The genotypes for each row of images are defined in the left margin and values in the top right corner of each image are genotype averages of stomata density (b–e), palisade cell density (f–i), or leaf thickness (j–m). Notation below the numbers indicates significant difference from Col‐0: ns, P > 0.05; *, P < 0.05; **, P < 0.01; ***, P < 0.001. All images were taken from the sixth rosette leaf (n = 8 for Col‐0, SPCH 2‐4A, and epf1;epf2; n = 4 for Col‐0 grown under high light). All SPEECHLESS (SPCH) and epidermal patterning factor (epf) lines were then grouped separately for regression analysis to determine relationships between adaxial stomatal density and palisade mesophyll cell density (n–o) and leaf thickness with leaf size (p–q). The regression analysis for each group includes the Col‐0 control plants. SPCH plants showed no significant relationship between cell type densities (n) (R 2 = 0.005, P = 0.685, n = 32) as indicated by the dotted line, but leaf thickness increased as a function of leaf area (p) (R 2 = 0.22, P < 0.01, n = 29), as indicated by the unbroken line. epf plants showed a positive relationship between cell type densities (o) (R 2 = 0.77, P < 0.001, n = 24), but leaf thickness and leaf area were not correlated (q) (R 2 = 0.029, P = 0.447, n = 22).
