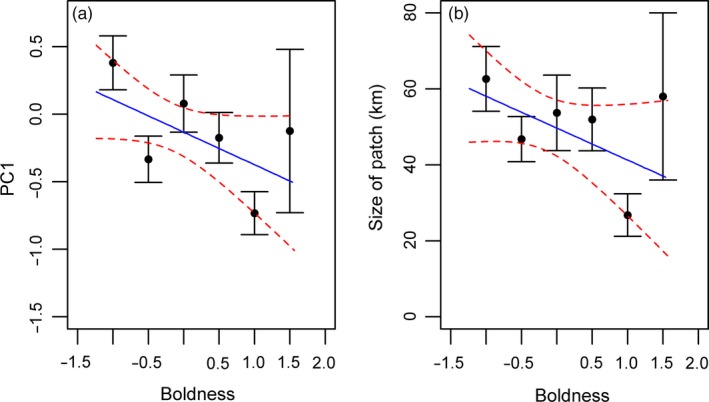
Figure 2.

Boldness and foraging traits: (a) Boldness and principal component one, indicative of an individual's position along an exploration–exploitation trade‐off (p = .045). (b) The size of foraging patches in relation to individual boldness (p = .026). For plotting purposes only, boldness scores are grouped and shown as the mean with standard errors (Boldness groups [N]: [−1.5, −1.0] (42); [−1.0, −0.5] (56); [−0.5, 0.0] (43); [0.0, 0.5] (35); [0.5, 1.0] (18); [1.0, 1.5] (3)). Raw data are shown in Appendix 2 Figure S1. The model prediction is plotted as a line with dashed 95% confidence intervals of the predicted line [Colour figure can be viewed at wileyonlinelibrary.com]
