
Figure 2.
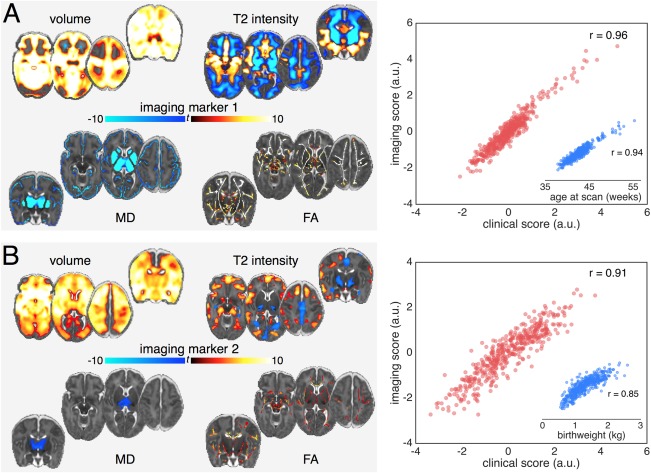
Imaging patterns correlating with age at scan and low birth weight. Image loadings associated with the first two canonical pairs (A: pair 1; B: pair 2). Maps are shown thresholded at p < 0.01 (corrected for multiple comparisons), the colour bar indicates the t‐statistic. Warm colours show regions positively correlated with the canonical variate, and vice versa. The correlation between the canonical imaging and clinical variates for each pair are shown in the scatterplot in red. Inset: scatterplot (blue) of the correlation between the imaging variate score and the clinical factor with the largest clinical variate loading. Unthresholded statistical maps are available to view online at http://neurovault.org/collections/2178.
a.u. = arbitrary units; FA = fractional anisotropy; MD = mean diffusivity.