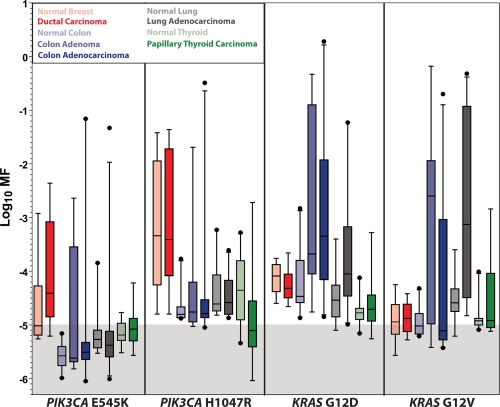
Figure 1.

The frequency distributions are shown for PIK3CA E545K, PIK3CA H1047R, KRAS G12D, and KRAS G12V in paired datasets of normal and malignant tissues. The data presented include that reported in the current publication, integrated with that reported previously [Parsons et al., 2010; Parsons and Myers, 2013; Myers et al., 2016, 2015, 2014a]. Measurements within the shaded area of the graph are below the lowest MF standard used and are considered below the limit of accurate ACB‐PCR quantification.
