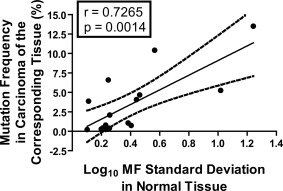
Figure 4.

Correlation between the log10 MF standard deviation for PIK3CA and KRAS hotspot point mutations in normal tissues and the frequencies with which the mutations occur in corresponding carcinomas (breast ductal carcinomas, colonic adenocarcinomas, lung adenocarcinomas, and papillary thyroid carcinomas) according to the COSMIC database (v76) [COSMIC, 2016]. Calculated MFs were used, except when calculated MFs were below the theoretical limit of detection 3.33 × 10⁻⁶ (log10 MF = −5.477, or one mutant molecule in a background of 3 × 10⁵ WT molecules).
